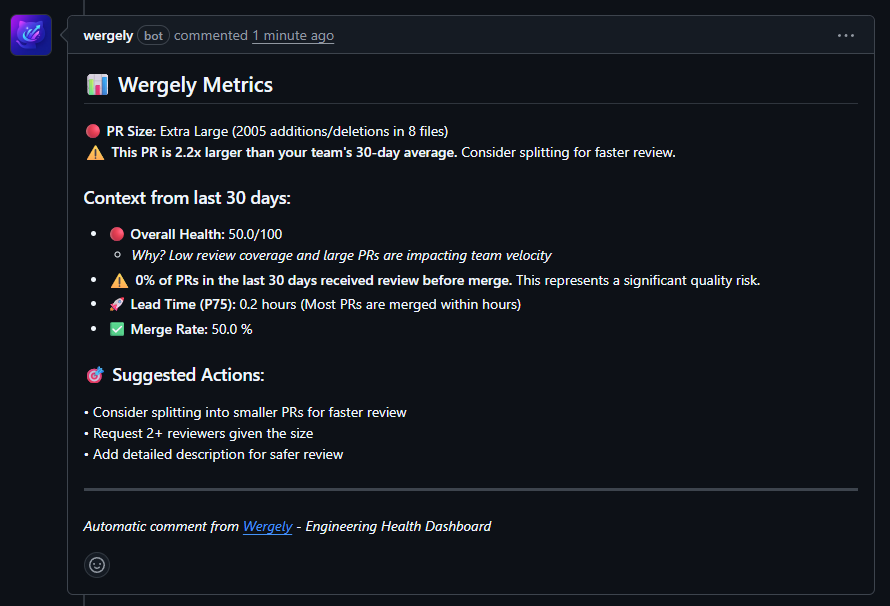
Metadata-only · No diffs · No code content stored

Missed reviews, uneven workload, hidden bottlenecks — before they slow your team down.
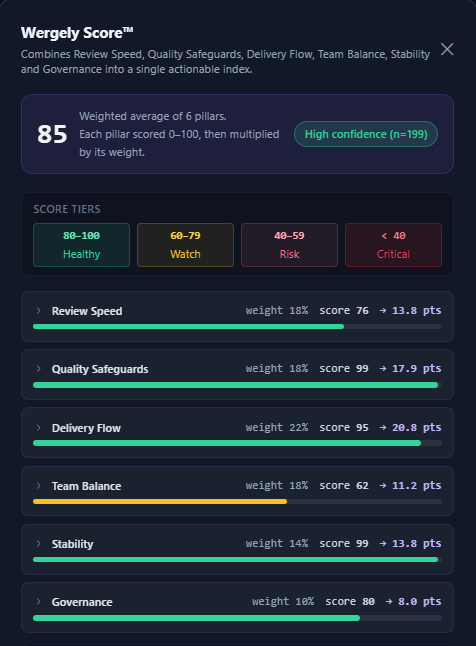
Engineering health,
finally measurable.

Wergely gives engineering teams a real-time pulse on their pull request workflow — review speed, team balance, lead time, and more. No code access required.

Wergely dashboard
The Wergely Framework

The Wergely Engineering Health Framework

A structured framework to measure, understand, and improve how your team delivers.

I

Review Speed

How quickly pull requests receive their first round of feedback.

II

Quality Safeguards

Percentage of merged PRs that received at least one approval.

III

Delivery Flow

How smoothly work moves from open to merged without friction.

IV

Team Balance

How evenly review workload is distributed across the team.

V

Stability

Composite metric of rework (reopen rate) and waste (abandon rate). Only calculated with 20+ PRs.

VI

Governance

Security and best practices based on branch protection rules. Evaluates 5 key protections on the default branch.

Each dimension is scored independently and combined into a transparent Engineering Health Score™

Automated PR Comments

Context-aware insights, right where your team works

Wergely automatically comments on pull requests with health metrics, warnings, and actionable suggestions based on your team's patterns.

Wergely PR Comment Example

Proactive guidance for every pull request

Size warnings

Alerts when PRs are larger than your team's average, suggesting splits for faster review.

Team context

Shows overall health score, lead time, merge rate, and quality metrics from the last 30 days.

Actionable suggestions

Specific recommendations like requesting additional reviewers or adding descriptions.

Quality risk alerts

Highlights when PRs lack reviews or when review coverage is below team standards.

Enable PR comments per repository in your settings. Comments are posted only when Wergely detects actionable insights.

The signals that actually shape engineering performance

Without instrumenting your codebase or storing a single line of code.

Improve review speed

See exactly how long PRs wait for a first review and how long they take to merge. Configurable targets, P75 scoring, period-over-period deltas.

Time to First Review Lead Time to Merge

Prevent hidden bottlenecks

Spot uneven review load before it becomes burnout. Track combined friction across your team and catch the patterns that slow delivery down.

Reviewer Balance Friction Index

Track overall health

A single auditable score across all six dimensions. Compare all your repos at a glance and jump to any dashboard in one click.

Health Score Multi-repo Overview

All the metrics that matter, nothing that doesn't

Built for engineering managers and senior engineers who want signal, not noise. Every metric is computed from GitHub PR metadata — no code, no secrets, no diffs.

Works with GitHub App or Personal Access Token
Snapshots cached in Redis — instant page loads
Configurable thresholds per organization
Period-over-period delta comparison
Export snapshots as JSON for your own analysis
Responsiveness
74
P75 TTFR vs target
Predictability
81
P75 lead time vs 30d
Balance
65
Reviewer distribution
Stability
88
Churn / hotspot score
Governance
92
Branch protection score
Friction Index
18.4
↓ 6.2 vs last period
Combined TTFR + lead time friction

Ready to see your team's health score?

Sign in and connect your GitHub repositories. Your first snapshot is ready in minutes.

Go to your dashboard → How to connect →

We use strictly necessary cookies to keep you signed in and remember your preferences. No tracking or advertising cookies are used. Privacy notice